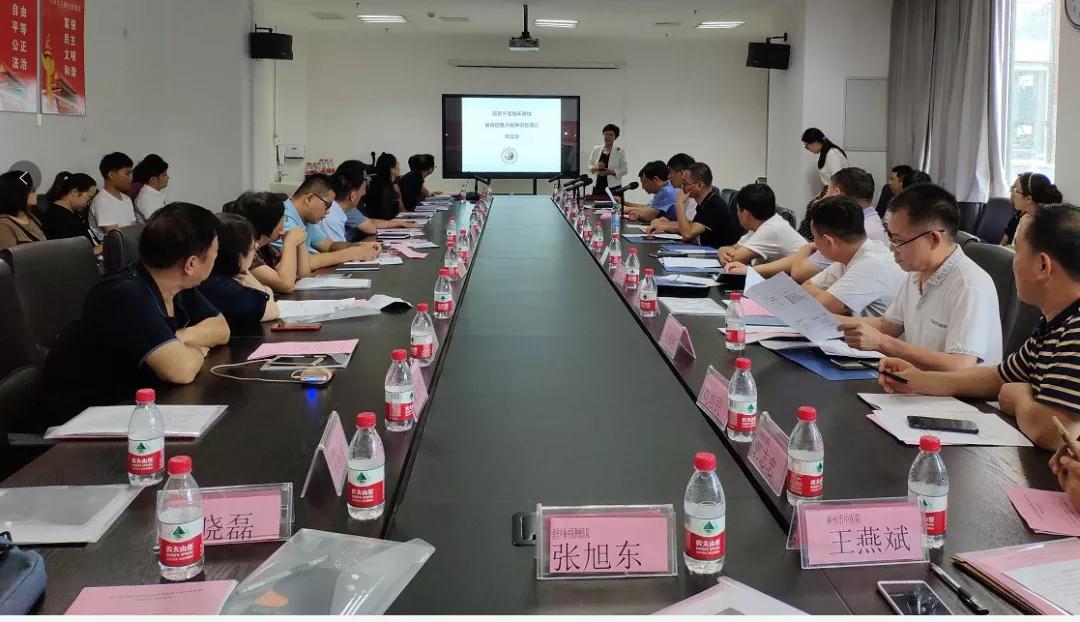
August 14, 2023
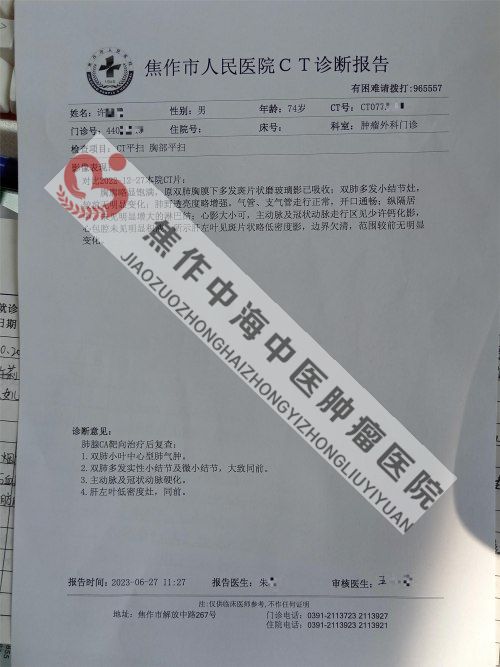
Primary liver cancer is the most common malignant tumor of the liver, which is closely related to hepatitis B and cirrhosis. 80% to 90% are hepatocellular carcinoma (HCC). Clinically, it can be divided into three types: ① giant type (with a diameter of ≥ 5cm), the most common type, accounting for more than half of the total number of liver cancer; ② Nodular type (mass diameter<5cm); 3 diffuse small nodules, distributed throughout the liver. Among them, hepatocellular carcinoma with a single nodule diameter ≤ 3cm or a sum of two nodule diameters not exceeding 3cm is considered small liver cancer. Liver cancer has a rich blood supply, and the mass can form a pseudocapsule.

X-ray examination mainly displays the blood supply of liver cancer through DSA angiography, providing an imaging basis for intervention.
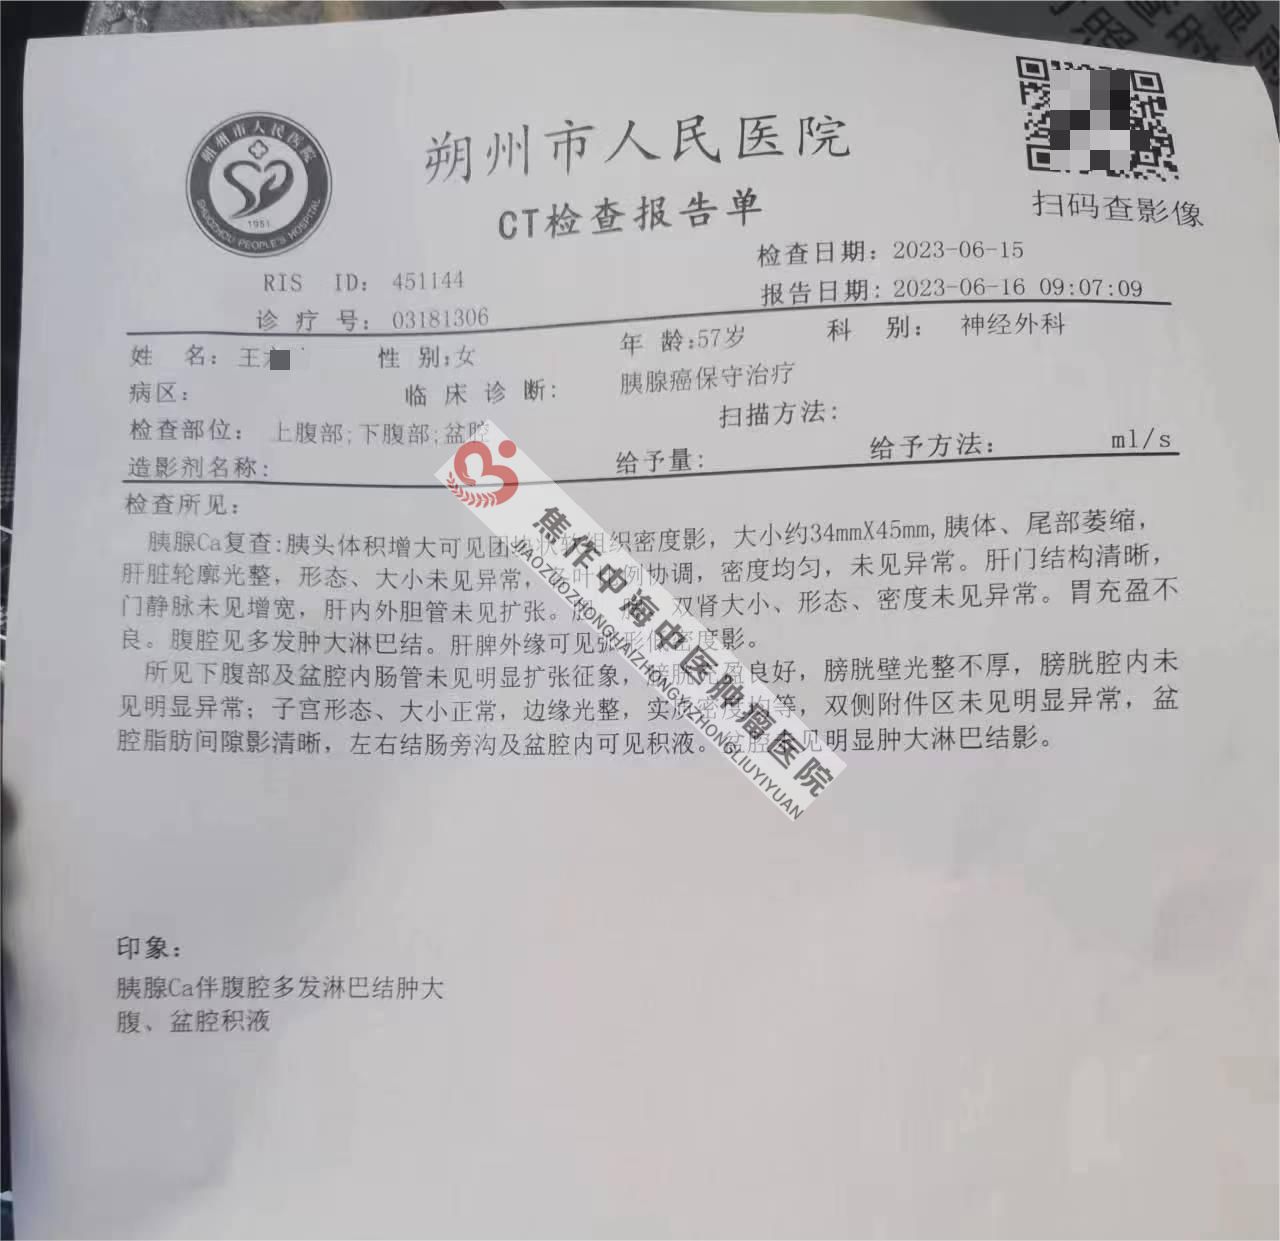
CT manifestation: Plain scan shows that most of the hepatocellular carcinoma masses are low-density, and there are also isodensity or high-density, these changes are related to the degree of differentiation and tissue composition of the lesion itself. Those with good differentiation are of equal density, while bleeding is of high density. CT scan of massive liver cancer shows single or multiple, circular or quasi circular low-density lesions with irregular boundaries. Necrosis density is lower in major lesions, while bleeding is higher in density. The appearance of small nodular lesions around the mass is called sub lesions. Nodular liver cancer has a clear boundary with surrounding liver tissue, and complete or incomplete circular low-density shadows can be seen around the tumor, which is called pseudocapsule. Diffuse liver cancer is characterized by liver enlargement, diffuse small nodules in the liver, and common portal vein thrombosis.
Enhanced scanning: Multiphase enhancement is of great significance in observing and analyzing the dynamic changes of tumor blood flow and the detection rate of small lesions. 99% of liver cancer is supplied by the hepatic artery, while 80% of the surrounding liver parenchyma is supplied by the portal vein. The enhancement effect of the two varies depending on the time phase. Within 20-30 seconds of arterial phase injection of contrast agent, patchy nodular early enhancement appeared within the scanned mass, transitioning from low-density on plain scan to high-density mass, with an increase in CT value. At this time, the liver supplied by the portal vein showed no signs of enhancement. After 60-70 seconds, the scan showed a portal vein phase, indicating that the enhancement density of liver parenchyma began to gradually increase, while the enhancement density of tumor lesions rapidly decreased. After a delay of 100-120 seconds, the scan enters a balanced phase, where the density of the liver parenchyma continues to increase while the density of the tumor lesion continues to decrease, reaching a low density state before enhancement. Based on the dynamic changes of CT enhancement, the CT values were measured and a time density curve was drawn, showing a rapid increase and decrease in the time density curve of liver cancer. The contrast agent entering the tumor showed a "fast in and fast out" characteristic.